Sunday, 10 July 2016

ABOUT ME


NAME: Muhamad Nur Yusri Bin Yunus
AGE: 21
Date Of Birth: 11 July 1994
Nationality: Brunei Darussalam
Race: Malay
Institution: Cosmopolitan College of Commerce and Technology
Course: Diploma in Information Technology

SET THEORY

INTRODUCTION

Understudies discover that a set is a gathering of items (components) that have something in like manner. We characterize a set by posting or depicting its components.

DEFINITION

set is an accumulation of particular items, considered as an article in its own particular right. For instance, the numbers 2, 4, and 6 are particular items when considered independently, however when they are considered all in all they frame a solitary arrangement of size three, composed {2,4,6}

SYMBOLS:


EXAMPLE:


VENN DIAGRAM

DEFINITION

In a Venn outline sets are spoken to by shapes; generally circles or ovals. The components of a set are marked inside the circle. Venn outlines are particularly valuable for indicating connections between sets.


SETS OF VENN DIAGRAM


EXAMPLES:


VIDEO


REFERENCES
(https://cdn.kastatic.org/KA-youtube-converted/jAfNg3ylZAI.mp4/jAfNg3ylZAI.png)(https://s-media-cache-ak0.pinimg.com/564x/f7/ba/64/f7ba6400664fd639142bf81bf43d70d3.jpg)(https://upload.wikimedia.org/wikipedia/commons/thumb/5/5a/PolygonsSetIntersection.svg/220px-PolygonsSetIntersection.svg.png) (http://www.mathgoodies.com/lessons/toc_unit15.html)
(http://www.mathgoodies.com/glossary/term.asp?term=Venn%20diagram)
(https://teachbytes.files.wordpress.com/2013/02/venn-diagram.jpg)
(https://i.ytimg.com/vi/kLlFeVRL0v4/maxresdefault.jpg)
(http://i.stack.imgur.com/wpfy4.png)

STEM AND LEAF PLOT

INTRODUCTION

A Stem and Leaf Plot is a unique table where every information quality is part into a "stem" (the principal digit or digits) and a "leaf" (more often than not the last digit)

DEFINITION

A plot where every information quality is part into a "leaf" (as a rule the last digit) and a "stem" (alternate digits).

EXPLANATION

Stem-and-leaf plots are a strategy for demonstrating the recurrence with which certain classes of qualities happen. You could make a recurrence conveyance table or a histogram for the qualities, or you can utilize a stem-and-leaf plot and let the numbers themselves to indicate essentially the same data.


FORMULA


SYMBOL


EXAMPLE:


VIDEO


REFENCES
(https://www.youtube.com/watch?v=OaJXJduRiIE) (https://i.ytimg.com/vi/8ooKmIIb0Yo/maxresdefault.jpg)
(http://www.bbc.co.uk/staticarchive/9e1d43fdc0891fc3ff696e6e49fbcf6f959ae0d9.gif)
(https://www.mathsisfun.com/data/stem-leaf-plots.html)

COMBINATION

What is Combination?

A combination is an arrangement of objects (numbers, letters, words, etc...) where order doesn't matter for example: 1, 2  is the same as 2, 1.

Formula:


EXAMPLE:

Evaluate 7c2:

7c2 = 7!/2!(7 - 2)! = 7*6*5*4*3*2*1 / 2*1 (5*4*3*2*1) = 7*6 / 2 * 1 = 42 / 2 = 21 (Answer)

There are 12 boys and 14 girls in Mrs. Schultzkie 's math class. Find the number of ways Mrs. Schultzkie can select a team of 3 students from the class of to work on a group project. The team is to consist of 1 girl and 2 boys.

             Order , or position, is not important. Using the multiplication continuing principle

                          12 C 2 (BOYS) * 14 C 1 (GIRLS) 12 * 11 / 2 * 1 * * 14 / 1 = 66 * 14 = 924


VIDEO


REFERENCES
(http://www.800score.com/content/gre/nCr1.gif)
(https://www.youtube.com/results?search_query=combination+in+mathematics)

PERMUTATION

INTRODUCTION

A set V comprises of n components if its components can be tallied 1, 2,..., n. As it were, the set V can be carried into a 1-1 correspondence with the set {1, 2, ..., n}. Frequently it's more advantageous to begin numbering from 0. At that point we get the set {0, 1, 2, ..., n-1}.

DEFINITION

The quantity of changes of an arrangement of n components is signified n! (affirmed n factorial.)

Ways:

1! = 1 ways
2! = 2 ways
3! = 6 ways
4! = 24 ways
5! = 120 ways
6! = 720 ways
7! = 5,040 ways
8! = 40,320 ways

EXPLANATION

i'm going to pick number 8 and why 8! the answer is 40,320?
It is simple, you just have to expand it for example 8*7*6*5*4*3*2*1* and the answer will be 40,320.

Symbols:

P! = Permutation
N! = Number selected
R! = Object from total


EXAMPLES:


VIDEO


REFERENCES

(https://www.youtube.com/watch?v=DROZVHObeko)
(http://www.careerarm.com/wp-content/uploads/2015/07/p-and-c-1.png)
(https://blogger.googleusercontent.com/img/b/R29vZ2xl/AVvXsEiKQMGTR0WnThQumZXMKd_aqnres05DhFGFdfvKjBAQkTJu8vBDOA0qBAAW9FUkmHAe6DXGZqlAnj4OxUf7Qud5Wd29CR5-q2-FGYS7-jTsIFgEEq4XQw_0lvWRmIfDoEebeltFDFEoMXk/s1600/permutation%201.JPG)
(https://i.ytimg.com/vi/0WDUWCtxM1U/maxresdefault.jpg) (http://www.cut-the-knot.org/do_you_know/permutation.shtml)

GEOMETRIC PROGRESSION

INTRODUCTION

A geometric grouping is an arrangement such that any component after the first is acquired by duplicating the former component by a consistent called the normal proportion which is signified by ratio. The regular proportion (r) is acquired by partitioning any term by the previous term.

DEFINITION

A sequence, such as the numbers 1, 3, 9, 27, 81, in which each term is multiplied by the same factor in order to obtain the following term. Also called geometric sequence.

EXPLANATION AND EXAMPLES

The formula and calculation are the same as Arithmetic Progression, only the different is we have to find the common ratio, not the common difference. for example:


OTHER FORMULA AND EXAMPLES


VIDEO


REFERENCES

(http://pad3.whstatic.com/images/thumb/5/54/Find-the-Sum-of-a-Geometric-Sequence-Step-2Bullet1.jpg/aid591689-728px-Find-the-Sum-of-a-Geometric-Sequence-Step-2Bullet1.jpg)
(http://pad3.whstatic.com/images/thumb/0/0a/Find-the-Sum-of-a-Geometric-Sequence-Step-1Bullet1.jpg/aid591689-728px-Find-the-Sum-of-a-Geometric-Sequence-Step-1Bullet1.jpg)
(http://www.mathsisfun.com/algebra/images/sequence.gif)
(http://mathematics.laerd.com/maths/geometric-progression-intro.php)
(http://www.thefreedictionary.com/geometric+progression)
(http://www.regentsprep.org/regents/math/algtrig/atp2/ArithG12.gif)
(http://pad3.whstatic.com/images/thumb/e/ef/Find-the-Sum-of-a-Geometric-Sequence-Step-4.jpg/670px-Find-the-Sum-of-a-Geometric-Sequence-Step-4.jpg)
(http://www.wikihow.com/images/4/4d/Find-Any-Term-of-a-Geometric-Sequence-Step-4.jpg)

Saturday, 9 July 2016

INEQUALITIES

INTRODUCTION

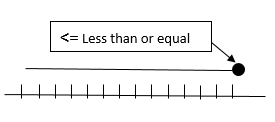
explanations that demonstrate the relationship between two (or more) expressions with one of the accompanying five signs: < , ≤ , > , ≥ , ≠  and presents the idea of disparities with variables, and demonstrates to discover an answer set for an in balance, given a substitution set.

SYMBOL OF INEQUALITIES


EXPLANATION


EXAMPLES:


VIDEO


REFERENCES 

(https://www.google.com.bn/search?biw=1536&bih=731&tbm=isch&sa=1&q=examples+of+inequalities&oq=examples+of+inequalities&gs_l=img.3..0i19l3j0i5i30i19j0i8i30i19l4.239438.243814.0.244026.26.18.1.7.7.0.112.1477.16j2.18.0....0...1c.1.64.img..0.26.1492...0j0i10i19j0i30i19.9Hcl2YKM--8#imgrc=ZDF3ELcMFG-xQM%3A)
(http://deeringmath.com/precalc/precalcbook/ch4graphics/chapter4__24.png)